Back to Course List
What's New in Microsoft Office 2016: Working With Excel 2016

- Product ID
- sonimo16ex_vod
- Training Time ?
- 24 to 33 minutes
- Language(s)
- English
- Video Format
- High Definition
- Required Plugins
- None
- Number of Lessons
- 8
- Quiz Questions
- 9
- Closed Captioning
- Question Feedback
- Wrong Answer Remediation
- Lesson Bookmarking
- Downloadable Resources
Overview
This course takes a look at the new features in Microsoft Office Excel 2016. With some amazing and powerful new features, it is easier than ever to create professional, data-rich workbooks and spreadsheets.
The course examines some of the program’s new features, such as flash fill, the timeline slicer, improved ways of working with data and charts, and formatting those data and charts to better make sense of it all.
Use this course among your organization so employees can become more proficient Excel 2016 users.
![]() This course is in the Video On Demand format, to read about Video On Demand features click here.
This course is in the Video On Demand format, to read about Video On Demand features click here.

- Install on any SCORM LMS
- Full-screen video presentation
- Print certificate and wallet card
- You have 30 days to complete the course

Workplaces
Categories
Audience
Anyone switching to Excel 2016
Topics
The course presents the following topical areas:
- Introduction
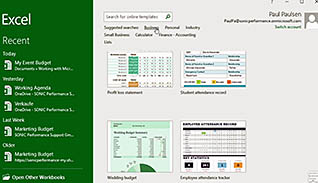
- Select a Template in Excel
- Update Data with Flash Fill
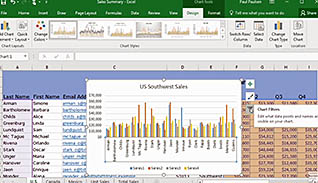
- Insert and Format a Chart
- Analyze Data
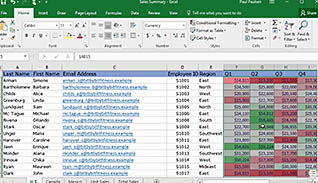
- Add Conditional Formatting to Data with Quick Analysis
- Add a Timeline Slicer
- Drill Deeper into your Data
Intended Performance Outcomes
Upon successful completion of this course you will be better prepared to:
-
Streamline workflow in Excel using templates.
- Recall the advantages of using Excel templates.
-
Accelerate data entry with Flash Fill.
- Differentiate between FlashFill and Auto Fill.
-
Incorporate charts.
- Recall how to create a clustered column chart.
- Locate the Chart Filters button.
- Identify the features of the Chart Filters button.
- Recall formatting options available with the Add Data Callout feature.
-
Add conditional formatting to data with Quick Analysis.
- Identify the functions of the Quick Analysis button.
-
Add a timeline slicer.
- Locate the Timeline slicer feature.
-
Drill deeper into your data.
- Locate the buttons to zoom in and out of various views of data.
© Mastery Technologies, Inc.
