Microsoft PowerPoint 2016 Level 1.7: Adding Charts to Your Presentation

- Product ID
- sonip16ac_vod
- Training Time ?
- 20 to 26 minutes
- Language(s)
- English
- Video Format
- High Definition
- Required Plugins
- None
- Number of Lessons
- 4
- Quiz Questions
- 6
- Closed Captioning
- Question Feedback
- Wrong Answer Remediation
- Lesson Bookmarking
- Downloadable Resources

A chart allows the audience to quickly understand the story you are telling with your data. Therefore, it is critical to know how to create eye-catching charts within a PowerPoint presentation. This training demonstrates how to create and format charts in PowerPoint 2016.
This video-based training demonstrates the simple process for creating charts, modifying them, and even inserting charts from Excel.
A presentation filled with charts is much more engaging than one with slide after slide of text and numbers. Use this course to get started making interesting PowerPoint 2016 presentations that your audience will love.
![]() This course is in the Video On Demand format, to read about Video On Demand features click here.
This course is in the Video On Demand format, to read about Video On Demand features click here.
- Install on any SCORM LMS
- Full-screen video presentation
- Print certificate and wallet card
- You have 30 days to complete the course

Anyone who creates PowerPoint presentations
- Introduction
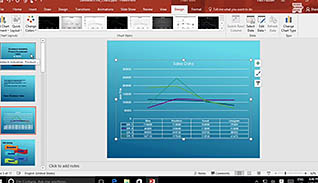
- Create a Chart
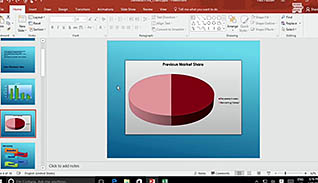
- Format a Chart
- Insert a Chart from Microsoft Excel
-
Create a chart in PowerPoint.
- Recall what feature is open when a chart is created.
- Select the function of the Switch Row or Column feature.
-
Format a chart in PowerPoint.
- Identify the features of the Format tab.
- Identify the features of the Design tab.
-
Insert a chart from Microsoft Excel.
- Recall how changes to a source file will affect the chart data in a PowerPoint presentation.
- Recall how to link data from an Excel spreadsheet into a PowerPoint presentation.
© Mastery Technologies, Inc.
