
- Product ID
- sonipbrt_vod
- Training Time ?
- 58 to 63 minutes
- Language(s)
- English
- Video Format
- High Definition
- Required Plugins
- None
- Number of Lessons
- 14
- Quiz Questions
- 5
- Closed Captioning
- Question Feedback
- Wrong Answer Remediation
- Lesson Bookmarking
- Downloadable Resources
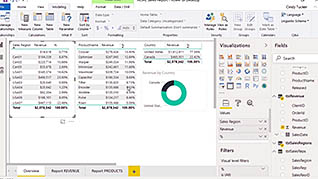

What is Power BI? Simply put, Power BI is a program that allows you to present data via interactive visualizations such as tables, charts, and graphs in an appealing and useful fashion. This online training, which is part of a series on Power BI, teaches users how to optimize their Power BI reports to improve their readability.
The more accurate and easily understood your reports are, the more impactful they become for your company. Furthermore, the more impactful your reports, the better your company’s decisions will be when based on those reports. You can ensure your reports are optimized via Power BI specifically through field properties, reference lines, and radial gauges, among other things, all of which you will learn about here. This course also demonstrates optimizing reports for your mobile device, as well as customizing your report’s visuals and design.
This course helps users create reports to present data in a meaningful way and provide the business intelligence needed for decision making. By utilizing the methods provided here, you can create more meaningful reports.
![]() This course is in the Video On Demand format, to read about Video On Demand features click here.
This course is in the Video On Demand format, to read about Video On Demand features click here.

- Install on any SCORM LMS
- Full-screen video presentation
- Print certificate and wallet card
- You have 30 days to complete the course

New Power BI users
- Edit Field Properties To Improve Readability
- Format Axes To Make Data Comparable
- Visualize Benchmarks With Reference Lines
- Add Annotations Using Text Boxes
- Create YoY Comparisons Conveniently
- Visualize Data On Maps To Valorise Reports
- Enrich Visualizations With Radial Gauges
- Enrich Visualizations With Conditional Formatting
- Perform Advanced Data Analysis By Using Filters And Slicers
- Add Custom Visuals
- Customize The Design Of A Report
- Save Key Findings In Easy-To-Access Bookmarks
- Optimize Reports For Mobile Devices
- Access From Anywhere With Power BI Mobile
© Mastery Technologies, Inc.
