Microsoft Excel 2016 Level 4.2: Analyzing Data by Using PivotTables

- Product ID
- sonie16pt_vod
- Training Time ?
- 29 to 37 minutes
- Language(s)
- English
- Video Format
- High Definition
- Required Plugins
- None
- Number of Lessons
- 5
- Quiz Questions
- 8
- Closed Captioning
- Question Feedback
- Wrong Answer Remediation
- Lesson Bookmarking
- Downloadable Resources

Excel has several powerful features for data analysis, one of which is the PivotTable. PivotTables allow you to extract specific pieces of information from a larger data field; in short, they allow you to focus on the data you deem most important. This course helps you fully utilize the functionality of a PivotTable, including how to summarize, organize, group and modify data.
Excel automatically totals the data in a PivotTable by either summarizing or counting the items within. If you are looking for more than that though, Excel allows you to customize how your data is presented and calculated using the value field settings. You could also simply create a custom calculated field in your PivotTable. This course demonstrates how to use these techniques to analyze your data.
Of course, summarizing your data is only one step in your analysis process. You must be able to organize your data so it is easy to understand. For example, you may want to group dates by month, quarter, or year. You can also filter the data and change the format of the PivotTable itself; it is important to maximize the functionality of your PivotTable while minimizing clutter, and this course shows you how. Utilize the information presented here and better sort, analyze, and present your data through PivotTables.
![]() This course is in the Video On Demand format, to read about Video On Demand features click here.
This course is in the Video On Demand format, to read about Video On Demand features click here.

- Full-screen video presentation
- Print certificate and wallet card
- You have 30 days to complete the course

Excel users interested in PivotTables
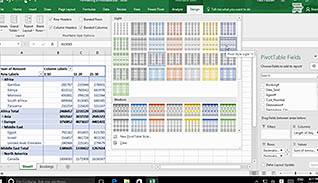
- Summarize PivotTable Data
- Organize PivotTable Data
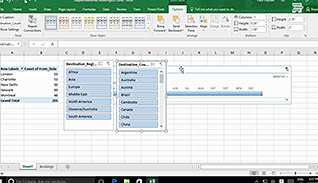
- Filter PivotTable Data
- Format A PivotTable
- Refresh And Change PivotTable Data
-
Summarize PivotTable data.
- Recall where a calculated field would appear with regards to a PivotTable.
- Identify how to reset a PivotTable summary of a cell.
-
Organize PivotTable data.
- Select options for grouping data in PivotTables.
- Identify available features to help organize data in PivotTables.
-
Filter PivotTable data.
- Recall which features will enable you to filter your data.
-
Format a PivotTable.
- Select available options in the Layout command group.
-
Refresh and change PivotTable data.
- Identify a shortcut for updating a PivotTable if source data changes.
- Recall where you can view the information about the file you are connected to.
© Mastery Technologies, Inc.
