Microsoft Excel 2010 - Presenting Data Using Charts

- Product ID
- soniepdu_vod
- Training Time ?
- 66 to 74 minutes
- Language(s)
- English
- Video Format
- High Definition
- Required Plugins
- None
- Number of Lessons
- 9
- Quiz Questions
- 8
- Question Feedback
- Wrong Answer Remediation
- Lesson Bookmarking
- Downloadable Resources
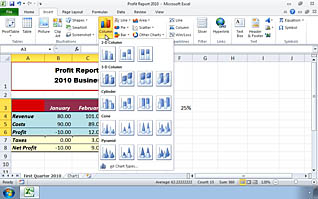
This training video provides the viewer with detailed information on creating charts in Microsoft Excel 2010. Learn ways to create, modify, and format charts to improve the organization of professional data. This training shows the viewer a step-by-step guide to creating charts within Microsoft Excel 2010.
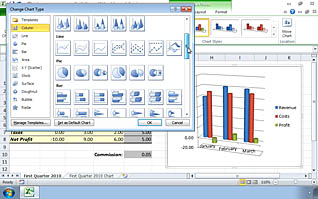
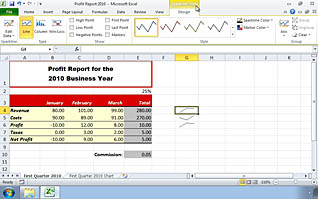
By creating charts, the viewer is also shown how to create a more visually appealing dataset. Sizing and resizing charts is explained through live-action video. This video also shows the viewer how to modify charts and data that already exists. By formatting existing data to more visually appealing charts, the viewer is shown how to then format charts to perfectly fit their business. Data ranges, axis, and labels are discussed in and the viewer is shown multiple ways to create a more visually-appealing and professional business. Key points are checked at the end of this training with a short quiz.
![]() This course is in the Video On Demand format, to read about Video On Demand features click here.
This course is in the Video On Demand format, to read about Video On Demand features click here.

- Full-screen video presentation
- Print certificate and wallet card
- You have 30 days to complete the course

Any professionals interested in gaining visual appeal for data charts, or those who wish to create more professionally organized data charts using Excel 2010
- Presenting Data Using Charts
- Creating a Chart
- Moving and Resizing Charts
- Changing Chart Type
- Formatting Charts
- Chart Data Ranges
- Format Axis
- Labels
- Sparklines
© Mastery Technologies, Inc.
